Apply RNA2seg on spatial data
This notebook presents the workflow for applying RNA2Seg on Zarr-saved dataset. The process is structured into five main steps:
1-Create training patches - Extract patches of a reasonable size to process efficiently (saved in the Zarr file).
2-Initialize an RNA2segDataset
3-Initialize a model RNA2Seg
4-Run segmentation: RNA2Seg is applied to the dataset to generate cell segmentations, which are then saved in a Zarr format.
5-Visualize segmentation
[1]:
import rna2seg
rna2seg.__version__
[1]:
'0.1.0'
[2]:
import warnings
warnings.filterwarnings("ignore")

import cv2
import spatialdata as sd
from pathlib import Path
Step 1: Create patches from Zarr files
In this step, the dataset (image + transcripts) is divided into patches of size patch_width × patch_width with an overlap of patch_overlap. This allows processing images of a manageable size while preserving spatial continuity.
Process
The dataset, stored in Zarr format, is loaded.
Patches coordinates are saved as a
Shapein the zarr:sopa_patches_rna2seg_[patch_width]_[patch_overlap].A
.rna2segdirectory is created to store the transcript data corresponding to each patch.The transcript information for each patch is saved in CSV format for further processing.
[3]:
# MODIFY WITH YOUR PATH

merfish_zarr_path = "/media/tom/Transcend/open_merfish/test_spatial_data/test005/sub_mouse_ileum.zarr"

### load sdata and set sdata's parameters
sdata = sd.read_zarr(merfish_zarr_path)
image_key = "staining_z3"
points_key = "transcripts"

channels_dapi= ["DAPI"]
channels_cellbound=["Cellbound1"]

gene_column_name="gene"

patch_width = 1200
patch_overlap = 150
min_points_per_patch = 0
folder_patch_rna2seg = Path(merfish_zarr_path) / f".rna2seg_{patch_width}_{patch_overlap}"
[4]:
from rna2seg.dataset_zarr.patches import create_patch_rna2seg

### create patch in the sdata and precompute transcipt.csv for each patch with sopa
create_patch_rna2seg(sdata=sdata,
                    image_key=image_key,
                    points_key=points_key,
                    patch_width=patch_width,
                    patch_overlap=patch_overlap,
                    min_points_per_patch=min_points_per_patch,
                    folder_patch_rna2seg = folder_patch_rna2seg,
                    overwrite = True)
print(sdata)
[INFO] (sopa.patches._patches) Added 16 patche(s) to sdata['sopa_patches_rna2seg_1200_150']
[########################################] | 100% Completed | 3.71 sms
[########################################] | 100% Completed | 3.17 ss
SpatialData object, with associated Zarr store: /media/tom/Transcend/open_merfish/test_spatial_data/test005/sub_mouse_ileum.zarr
├── Images
│     └── 'staining_z3': DataTree[cyx] (5, 3704, 3704), (5, 1852, 1851), (5, 926, 926), (5, 463, 463), (5, 232, 232)
├── Points
│     └── 'transcripts': DataFrame with shape: (<Delayed>, 10) (3D points)
└── Shapes
      ├── 'Cellbound1': GeoDataFrame shape: (569, 1) (2D shapes)
      ├── 'DAPI': GeoDataFrame shape: (409, 1) (2D shapes)
      └── 'sopa_patches_rna2seg_1200_150': GeoDataFrame shape: (16, 3) (2D shapes)
with coordinate systems:
    ▸ 'microns', with elements:
        staining_z3 (Images), transcripts (Points), Cellbound1 (Shapes), DAPI (Shapes), sopa_patches_rna2seg_1200_150 (Shapes)
Step 2: Initialize a RNA2segDataset
[5]:
import albumentations as A
from rna2seg.dataset_zarr import RNA2segDataset

transform_resize  = A.Compose([
    A.Resize(width=512, height=512, interpolation=cv2.INTER_NEAREST),
])

dataset = RNA2segDataset(
    sdata=sdata,
    channels_dapi=channels_dapi,
    channels_cellbound=channels_cellbound,
    patch_width = patch_width,
    patch_overlap = patch_overlap,
    gene_column=gene_column_name,
    transform_resize = transform_resize,
    patch_dir=folder_patch_rna2seg
)
default shape_patch_key set to sopa_patches_rna2seg_1200_150
100%|██████████| 16/16 [00:00<00:00, 38.49it/s]
Number of valid patches: 9
Step 3: Initialize a model RNA2seg
With pretrained_model = "default_pretrained", a trained RNA2seg model is downloaded from Hugging Face. You can also specify pretrained_model other available models or to use your own RNA2seg model.
[6]:
from rna2seg.models import RNA2seg


device = "cpu"


rna2seg = RNA2seg(
    device,
    net='unet',
    flow_threshold = 0.9,
    cellbound_flow_threshold = 0.4,
    pretrained_model = "default_pretrained"
)
No module named 'vmunet'
VMUnet not loaded
initiaisation of CPnet
Initiaisation of ChannelInvariantNet
Downloading pretrained model from huggingface /home/tom/.cache/huggingface/hub/models--aliceblondel--RNA2seg/snapshots/26f9afe181ea58f808ecd9c0732c327936020b18
Loading weights from /home/tom/.cache/huggingface/hub/models--aliceblondel--RNA2seg/snapshots/26f9afe181ea58f808ecd9c0732c327936020b18/rna2seg.pt
Step 4: Run segmentation
We will run the segmentation on the entire dataset and save the results as a shape in the Zarr file.
[7]:
from tqdm import tqdm
from rna2seg.utils import save_shapes2zarr

for i in tqdm(range(len(dataset))):
    input_dict = dataset[i]
    rna2seg.run(
        path_temp_save=folder_patch_rna2seg,
        input_dict=input_dict
    )
11%|█ | 1/9 [00:04<00:39, 4.96s/it]
64 cells detected
22%|██▏ | 2/9 [00:07<00:25, 3.69s/it]
62 cells detected
33%|███▎ | 3/9 [00:11<00:22, 3.79s/it]
87 cells detected
44%|████▍ | 4/9 [00:17<00:21, 4.40s/it]
112 cells detected
56%|█████▌ | 5/9 [00:21<00:17, 4.41s/it]
103 cells detected
67%|██████▋ | 6/9 [00:24<00:11, 3.87s/it]
57 cells detected
78%|███████▊ | 7/9 [00:28<00:07, 3.93s/it]
87 cells detected
89%|████████▉ | 8/9 [00:31<00:03, 3.84s/it]
65 cells detected
100%|██████████| 9/9 [00:35<00:00, 3.96s/it]
54 cells detected
Add segmented cell in the spatialdata as shape
The segmentation of each patch are stored in folder_patch_rna2seg and can be add in the spataildata as follow :
[8]:
segmentation_shape_name = "test_rnas2eg"
save_shapes2zarr(dataset=dataset,
                 path_parquet_files=folder_patch_rna2seg,
                 segmentation_key=segmentation_shape_name,
                 )
sdata
100%|██████████| 9/9 [00:00<00:00, 280.63it/s]
len(list_all_cells) 691
Resolving conflicts: 100%|██████████| 872/872 [00:00<00:00, 3249.51it/s]
Added 546 cell boundaries in sdata['test_rnas2eg']
[8]:
SpatialData object, with associated Zarr store: /media/tom/Transcend/open_merfish/test_spatial_data/test005/sub_mouse_ileum.zarr
├── Images
│     └── 'staining_z3': DataTree[cyx] (5, 3704, 3704), (5, 1852, 1851), (5, 926, 926), (5, 463, 463), (5, 232, 232)
├── Points
│     └── 'transcripts': DataFrame with shape: (<Delayed>, 10) (3D points)
└── Shapes
      ├── 'Cellbound1': GeoDataFrame shape: (569, 1) (2D shapes)
      ├── 'DAPI': GeoDataFrame shape: (409, 1) (2D shapes)
      ├── 'image_patches': GeoDataFrame shape: (16, 3) (2D shapes)
      ├── 'sopa_patches_rna2seg_1200_150': GeoDataFrame shape: (16, 3) (2D shapes)
      └── 'test_rnas2eg': GeoDataFrame shape: (546, 1) (2D shapes)
with coordinate systems:
    ▸ 'global', with elements:
        test_rnas2eg (Shapes)
    ▸ 'microns', with elements:
        staining_z3 (Images), transcripts (Points), Cellbound1 (Shapes), DAPI (Shapes), image_patches (Shapes), sopa_patches_rna2seg_1200_150 (Shapes)
with the following elements not in the Zarr store:
    ▸ image_patches (Shapes)
with the following elements in the Zarr store but not in the SpatialData object:
    ▸ Cellbound1_consistent_with_nuclei (Shapes)
    ▸ DAPI_consistent_not_in_cell (Shapes)
    ▸ DAPI_consistent_in_cell (Shapes)
    ▸ Cellbound1_consistent_without_nuclei (Shapes)
    ▸ sopa_patches_rna2seg_1200_50 (Shapes)
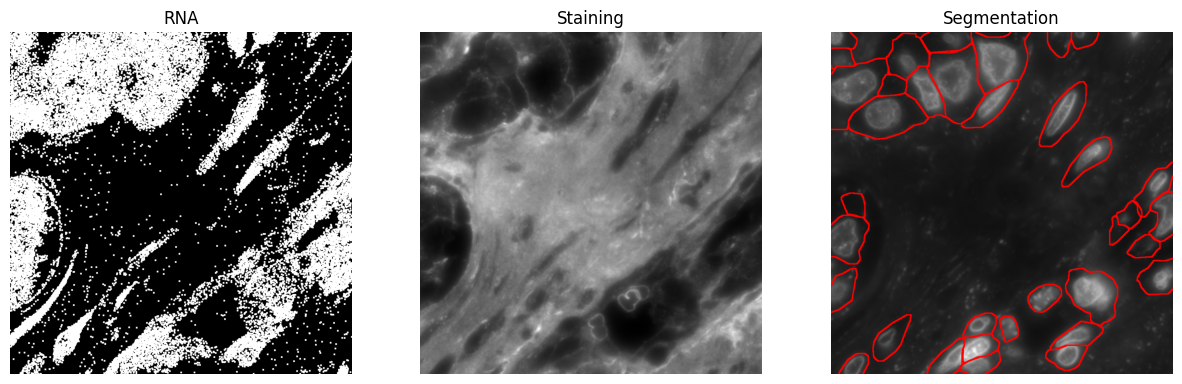
Step 5: Visualize segmentation
Now, we visualize the results. The following code extracts and plots three images: RNA transcripts, a selected staining image, and the corresponding segmentation. Ensure that staining_id is valid to avoid indexing errors, and check that bounds are within dataset limits.
[9]:
import matplotlib.pyplot as plt

# Parameters
key_segmentation="test_rnas2eg"
bounds = [2000, 2000, 3000, 3000,] # xmin, ymin, xmax, ymax
staining_id = 1 # Staining to plot

# Get images
rna = dataset.get_rna_img(bounds, key_transcripts=points_key,)
image = dataset.get_staining_img(bounds)
seg = dataset.get_segmentation_img(bounds, key_cell=key_segmentation)

# Plot
fig, axes = plt.subplots(1, 3, figsize=(15, 5))
axes[0].imshow(rna)
axes[0].set_title("RNA")
axes[0].axis("off")

axes[1].imshow(image[staining_id], cmap="grey")
axes[1].set_title("Staining")
axes[1].axis("off")

axes[2].imshow(seg)
axes[2].set_title("Segmentation")
axes[2].axis("off")

plt.show()
Get RNA image ...
Get image ...
Get segmentation image ...
Get image ...
100%|██████████| 52/52 [00:01<00:00, 40.86it/s]
Clipping input data to the valid range for imshow with RGB data ([0..1] for floats or [0..255] for integers). Got range [0.0..3.0].
[ ]:
[ ]:
[ ]: